
Kinetic energy and response dynamics considerations of two dimensional thin structure for noise and vibration control: Experimental and simulation results.
Abstract
This paper presents the results of simulations and experimental tests carried out on a simple two dimensional thin structure. The study shows good agreement between the results obtained with the NX/Simcenter simulation package and experimental measurements. The response dynamics solver can be used to evaluate the flexural vibration of flexible structures. The results then can be used to design and implement dedicated passive or active noise and vibration control system. The quick evaluation can improve the performance of such a system, reduce the required time to market and man-hour costs.
Introduction
The trend of mass reduction in modern structures is vastly followed by higher vibration and structure-born noise problem. Moreover, the cut costs requires that the acoustic materials would be used in specific areas rather than on the entire structure. The finite element method (FEM) techniques can be a good alternative method for the prediction of the vibration properties. The simulation methods can predict the properties before the production process, but what is more important they can be used to evaluate the structure after being fabricated for the proper application of the noise and vibration solutions. After the fabrication process the structure can be easily tested using operating deflection shape (ODS) or laser vibrometer [1]. However, it requires preparation of the complex test setups, equipment and large man hour. This paper presents a comparison of simulations and measurements performed on a thin rectangular structure for the noise and vibration control.
Setup
Figure 1 presents a scheme of the laser vibrometer test setup for the natural frequency and mode shapes of the clamped plate, while Table 1 presents mechanical parameters.
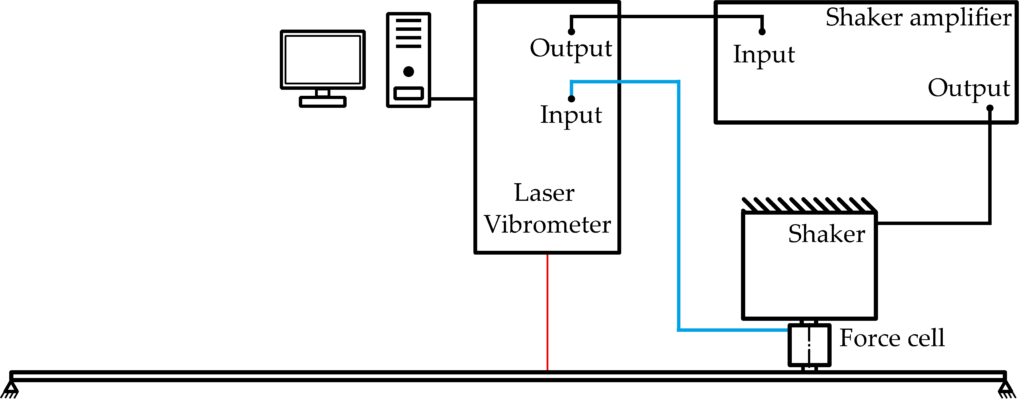
Figure 1. Scheme of the classical test setup for the laser vibrometer measurement for the rectangular plate measurement.
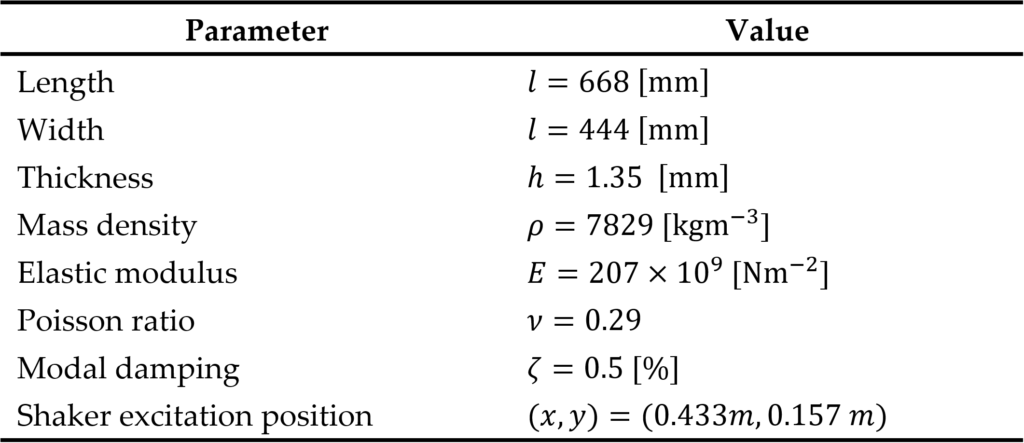
Table 1. Geometrical and physical properties of the rectangular plate.
The experimental test rig can be represented by a mathematical model of a clamped rectangular plate structure. The mode shapes of the plate are given by [2-4]:

where lx , lx are the dimensions, h thickness of the plate and i1, i2 are the modal indices for the i-th mode. The x and y dimensions can be associated with the nodes position of the mesh. The flexural natural frequency for the clamped rectangular plate is given by:
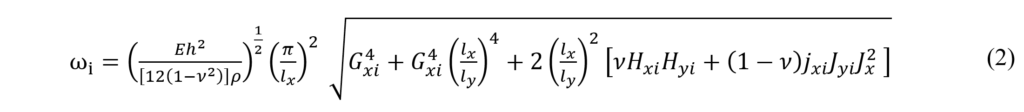
where ρ is the density, E is Young’s modulus and v Poisson ratio of the plate material. Detailed mathematical description of the plate mobility and impedance formulations can be found in references [5,6].
The global parameter considered in this study is the averaged total flexural kinetic energy (KE), which for the time harmonic vibrations is given by:

where ![]()
![]() is the transverse velocity of the plate and A is the surface area. In the simulations study, the kinetic energy parameter can be evaluated based on the transverse velocity of sampled nodes that are evenly distributed on the structure. The kinetic energy parameter is typically used to evaluate the global performance of the structure borne noise or vibration damping solution, whereas the frequency response functions provide information about local performance [7].
is the transverse velocity of the plate and A is the surface area. In the simulations study, the kinetic energy parameter can be evaluated based on the transverse velocity of sampled nodes that are evenly distributed on the structure. The kinetic energy parameter is typically used to evaluate the global performance of the structure borne noise or vibration damping solution, whereas the frequency response functions provide information about local performance [7].
Results
Table 2 presents the comparison of the measurement and simulation results for the first six natural frequencies and representative mode shapes of the rectangular plate. The measured modal shapes and natural frequencies agree well with simulated results.
Table 2. Comparison of the measurement and simulation results for the rectangular plate.
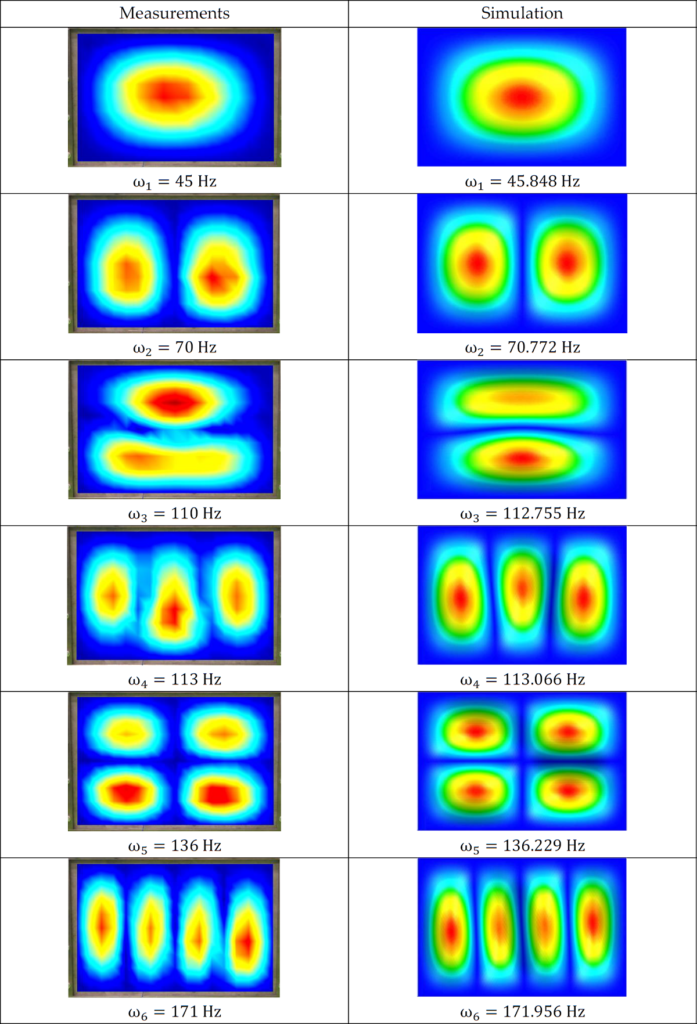
Figure 2 and 3 presents the simulation and measurement frequency response functions of the plain plate for the collocated points, while Figure 4 and 5 presents for the non-collocated points. It can be noticed a very good agreement between the simulation and measurement results. The non-collocated clearly show the lack of the antiresonance thoughts and phase drop over the -180°. The non-collocated point was selected for the potential location of the noise and vibration damping solution.
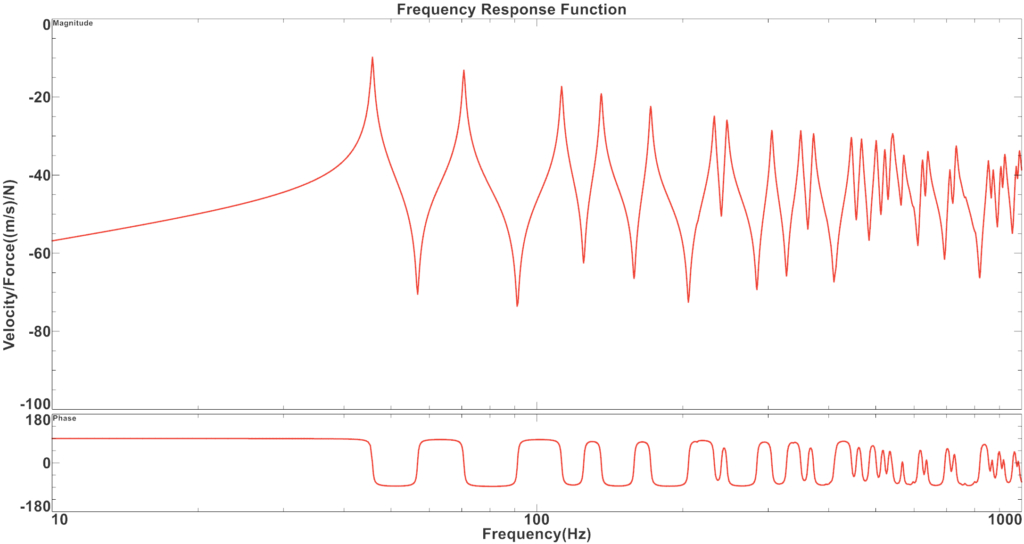
Figure 2. Simulated frequency response function of the rectangular plate for the collocated point.
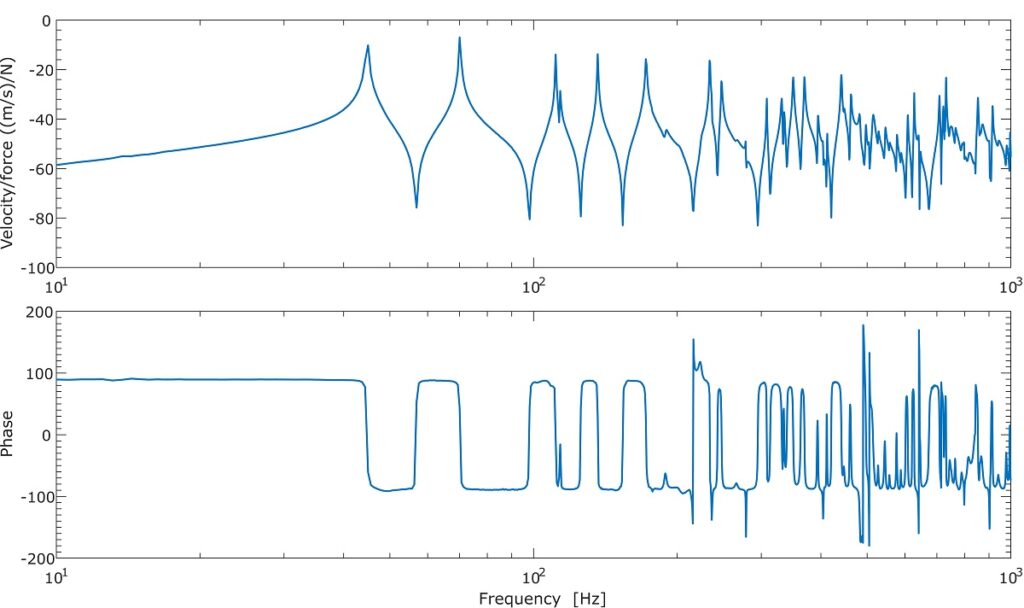
Figure 3. Measured frequency response function of the rectangular plate for the collocated point.
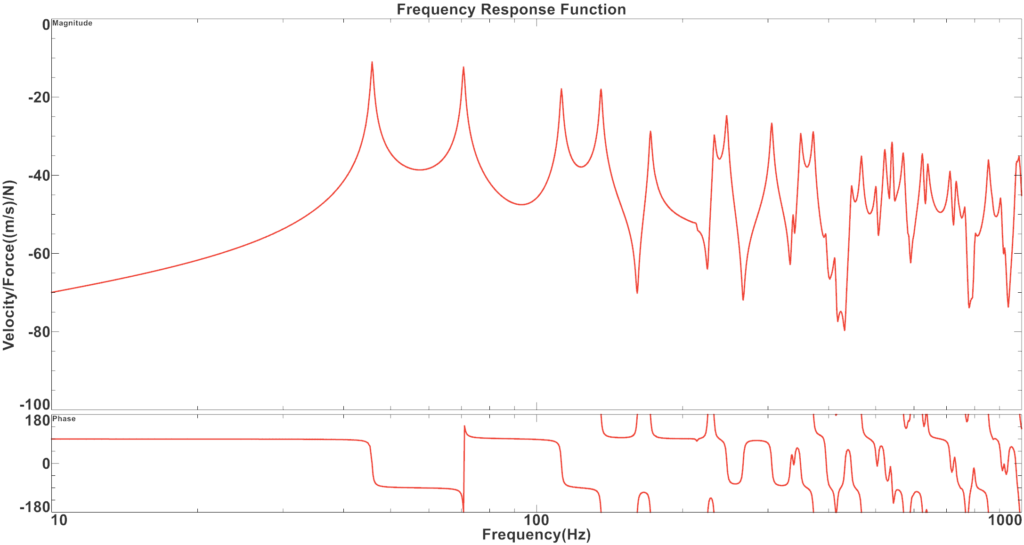
Figure 4. Simulated frequency response function of the rectangular plate for the non-collocated point.
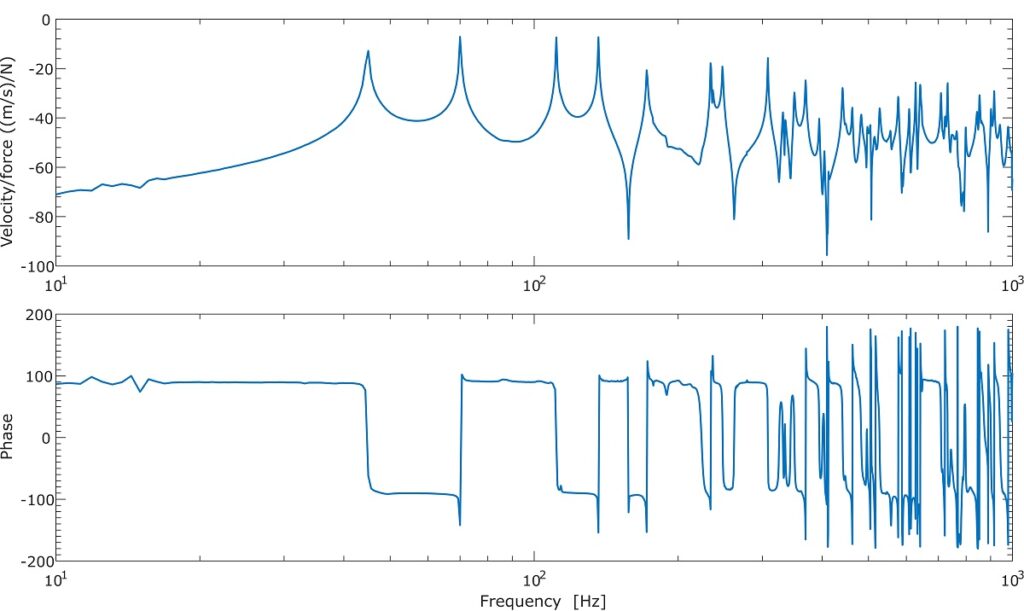
Figure 5. Measured frequency response function of the rectangular plate for the non-collocated point.
Results in Figure 2 and 3 can be used to evaluate the proper location of the sensor-actuator pair used in the active noise and vibration control. The non-collocated position will not guarantee proper stability e.g. of the velocity feedback control system. Quick simulation study using the response dynamics package in NX/Simcenter can be used to evaluate the location of the sensor-actuator pair and thus the stability of the feedback control loops.
Figure 5 presents measured (blue line) and simulated (red line) spectra of the kinetic energy per unit force excitation for the plane rectangular plate. The experimental results were based on 187 evenly distributed measurement points, while the simulation results were based on 90 calculated in NX/Simcenter velocity/force FRF. Although, the numerical results were based on a much lower number of reference points the obtained results agree well with the experimental results. What is more important to notice is the good overlapping of the resonances at the entire frequency range (10-1000 Hz) considered in this study. The slight difference in the amplitudes and additional modes obtained at higher frequencies could be caused by the nonlinearities in a damping factor of the plate and structure designed for clamping the plate.
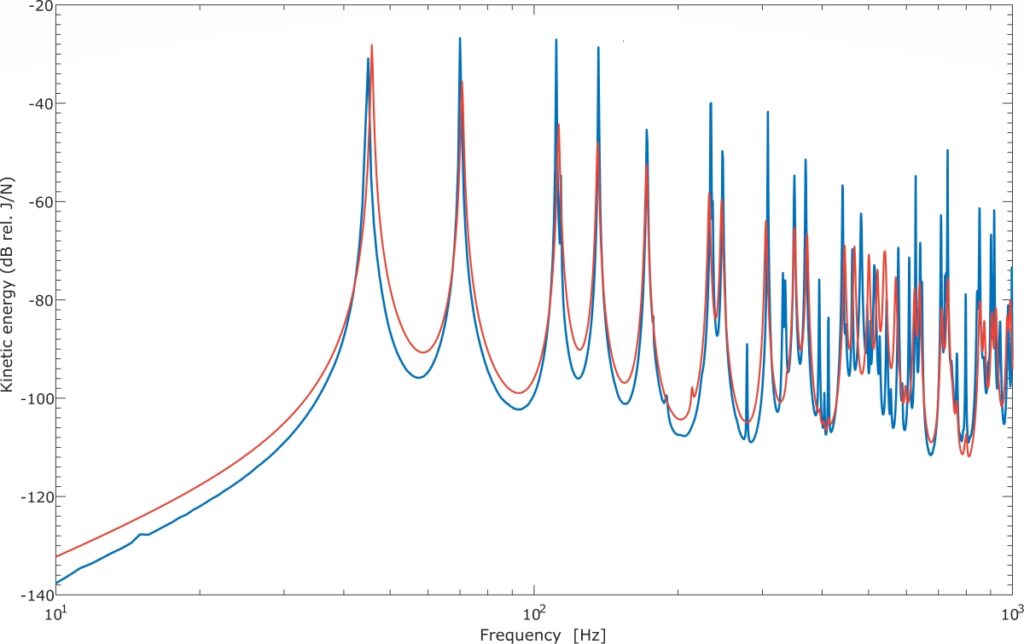
Figure 6. Experimental (blue line) and simulated (red line) results of the kinetic energy.
Conclusions
In this paper the numerical and experimental methods were presented on the global and local noise and vibration prediction of the simple plane rectangular structure. The results show good agreement between the simulation and experimental results both for local and global dynamic response parameters. The NX/Simcenter simulation package can be easily used to predict and evaluate the dynamic characteristics. The dynamic response simulations can be used to design a dedicated damping solution for the structure born noise and vibration problems. The NX/Simcenter simulation can be more time and cost efficient compared to the laser vibrometer or ODS measurements. Although the presented results were obtained for a rather simple structure, one can clearly notice that the NX/Simcenter can be a powerful tool for performing simulation studies of more complex structures.
References
[1] M. A. Peres, R. W. Bono, D. L. Brown, Practical Aspects of Shaker Measurements for Modal Testing, Proceedings of ISMA2010, Leuven, BE, 2010.
[2] C. Fuller, S. J. Elliott, P. A. Nelson, Active Control of Vibration, Academic Press, San Diego, CA, (1996).
[3] F. Fahy, P. Gardonio, Sound and structural vibration. Radiation, Transmission and Response 2nd ed. Academic Press, London (2007).
[4] R. D. Blevins, Formulas for Dynamics, Acoustics and Vibration, John Wiley & Sons, Ltd, Chichester, UK, (2015).
[5] P. Gardonio, M. J. Brennan, Mobility and impedance methods in structural dynamics, in: F. J. Fahy, J. Walker (Eds.), Advanced Applications in Acoustics, Noise & Vibration, Spon Press, London, (2004), Chapter 9.
[6] A. Kras, P. Gardonio, Active vibration control unit with a flywheel inertial actuator 464 (2020).
[7] S. Camperi, M. G. Tehrani, S. J. Elliott, Local tuning and power requirements of a multi-input multi- output decentralised velocity feedback with inertial actuators, Mechanical Systems and Signal Processing 117 (2019) 689-708.
Authors:
Klara Juros, Maksymilian Gut, Aleksander Kras, Silencions company